Claude Code Chrome Remote Debugging: 5 Easy Steps That Work
This guide explains how to connect Claude Code to your running Chrome browser using Chrome DevTools MCP and remote debugging. Key steps: install the MCP server, launch Chrome with a custom profile and `--remote-debugging-port=9222` flag, and create a one-click launcher. This enables Claude to take screenshots, inspect DOM, and run JavaScript in your actual browser sessions.
If you've tried to get Claude Code to interact with your Chrome browser — taking screenshots, inspecting pages, running JavaScript on your open tabs — you've probably hit a wall of confusing errors. Claude Code Chrome remote debugging sounds straightforward, but the setup has several gotchas that aren't documented anywhere.
I just spent an afternoon debugging the debugger. Here's everything I learned so you don't have to.
Why You'd Want Claude Code to See Your Browser
Claude Code is powerful for writing and editing code. But sometimes you need it to see what's happening in the browser — your actual browser, with your logged-in sessions, your open tabs, your cookies.
Use cases where this matters:
- Debugging a live site — Claude Code can inspect the DOM, check console errors, and see exactly what you're seeing
- Testing changes in real time — make a code change, then have Claude verify the result visually
- Scraping authenticated pages — access content behind logins without sharing credentials
- Automating repetitive browser tasks — fill forms, click through flows, extract data from dashboards you're already logged into
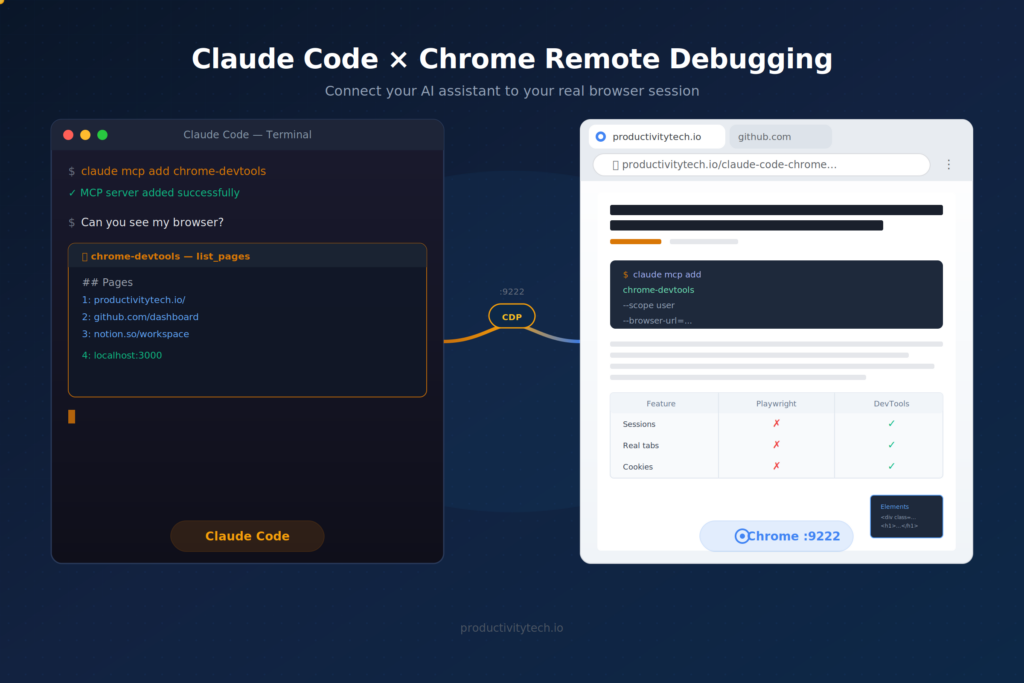
The key tool that makes this possible is the Chrome DevTools MCP — Google's official MCP server that connects AI tools to Chrome via the Chrome DevTools Protocol (CDP).
Playwright MCP vs Chrome DevTools MCP: Know the Difference
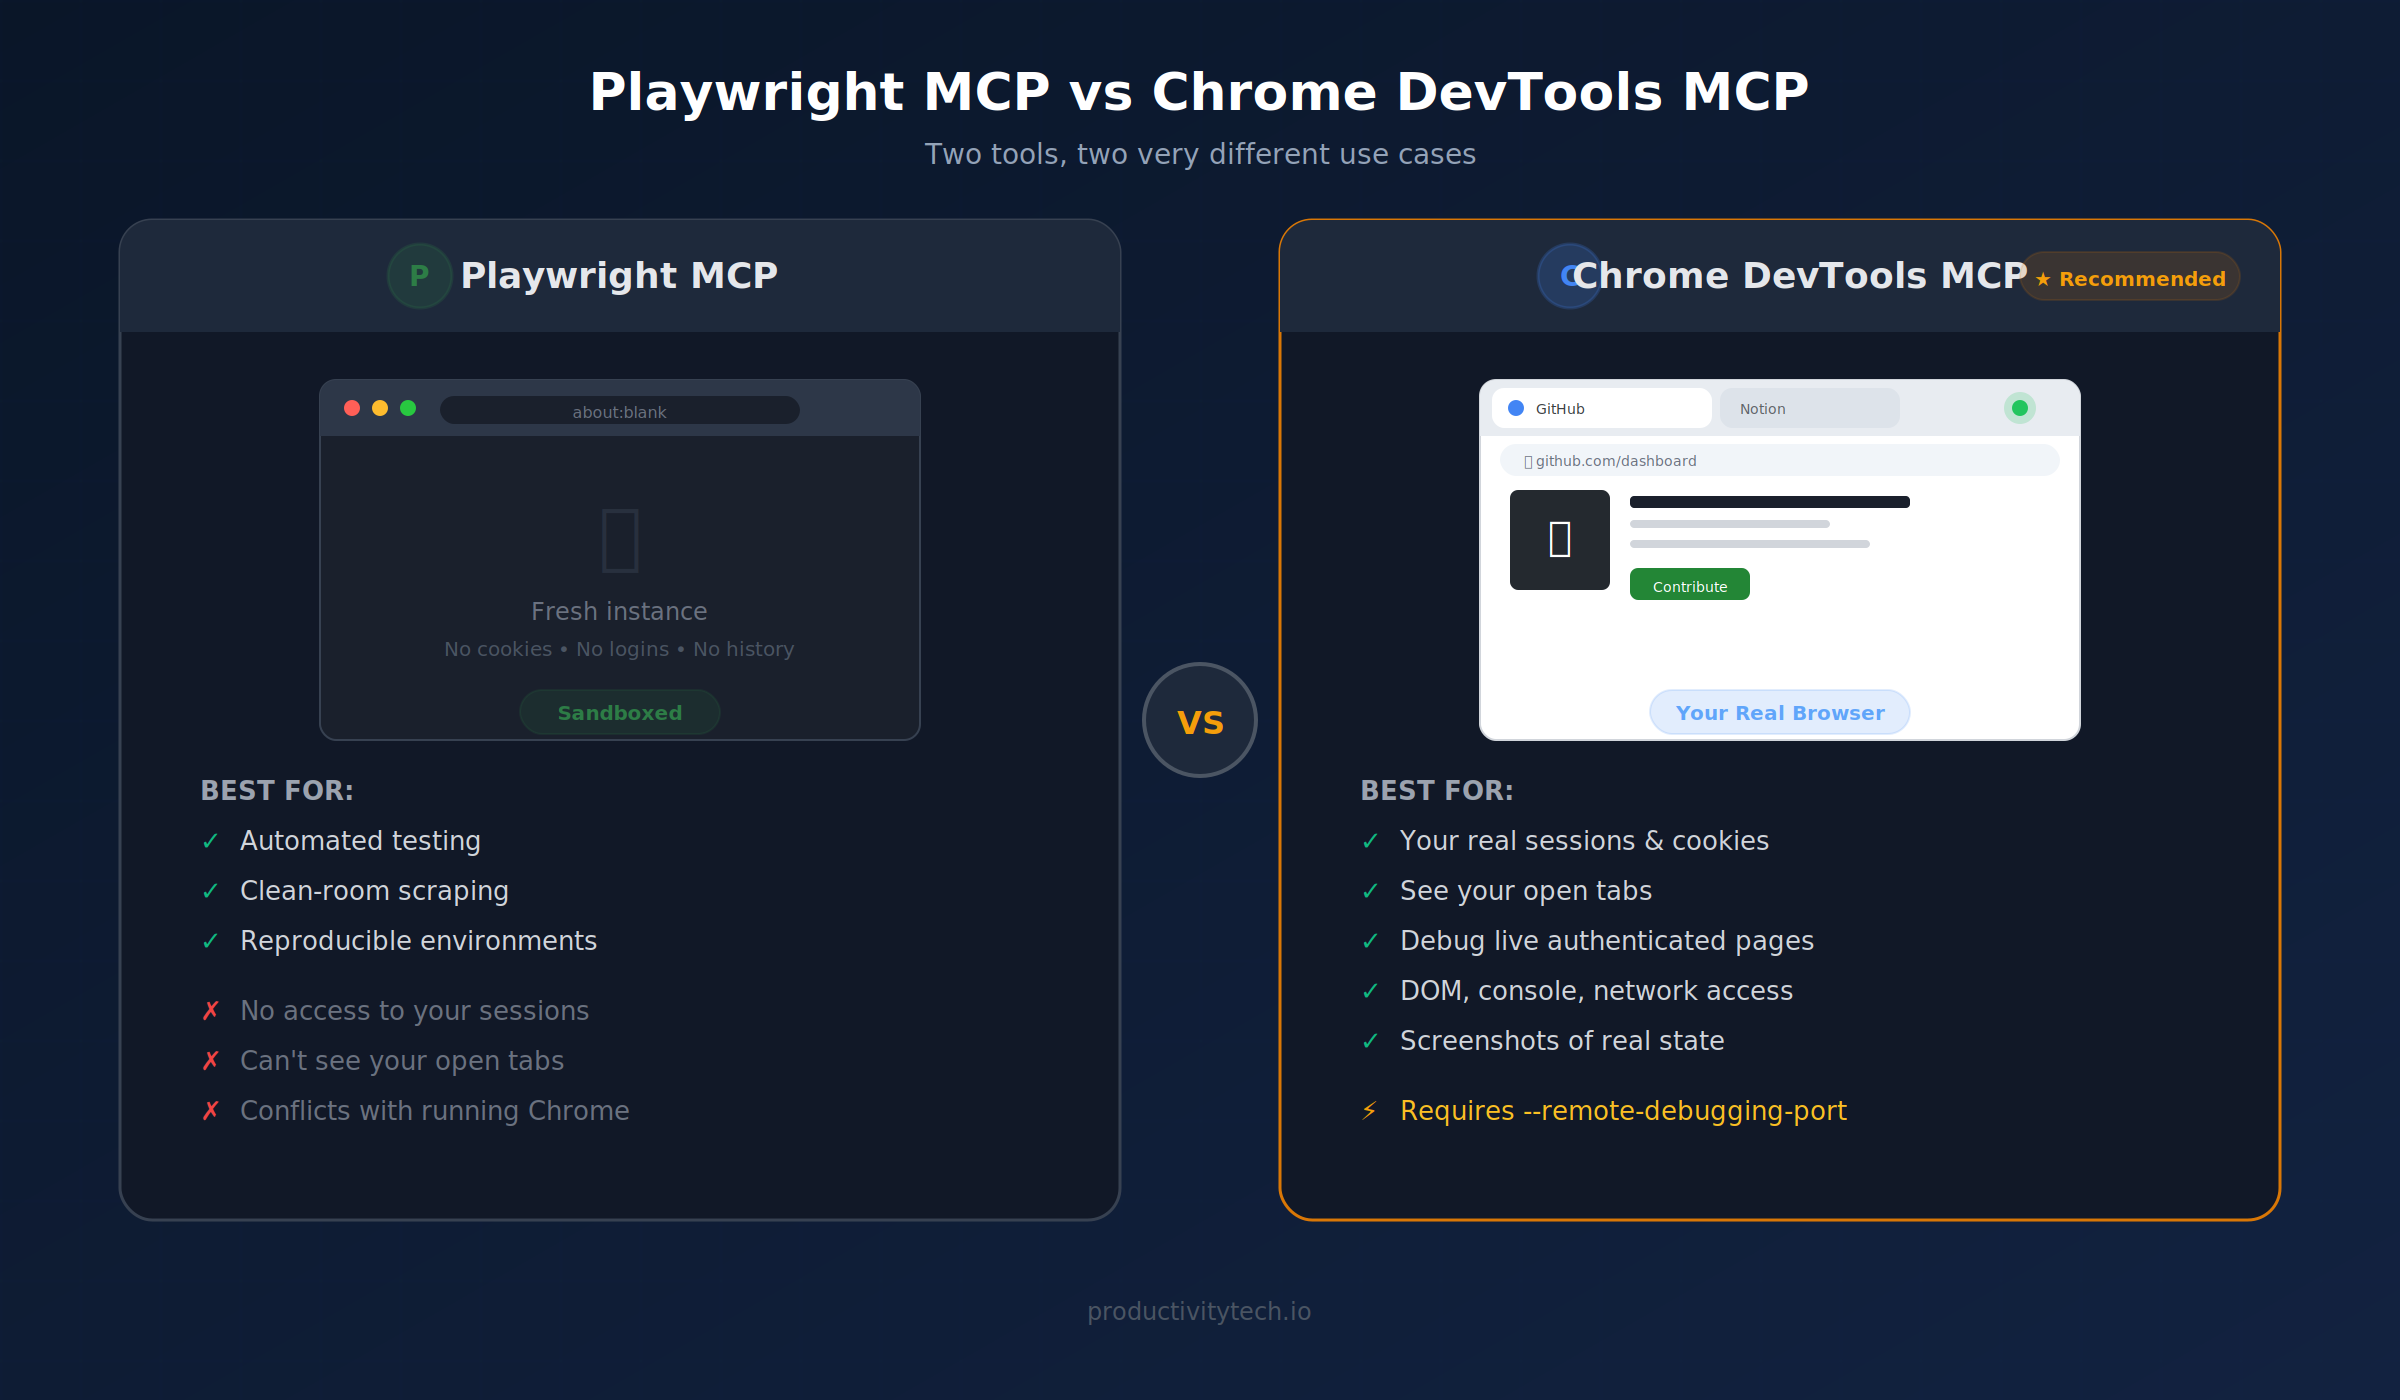
Before diving into setup, it's important to understand that there are two different browser MCP servers, and they solve different problems:
| Feature | Playwright MCP | Chrome DevTools MCP |
|---|---|---|
| How it works | Launches its own isolated Chrome instance | Connects to your already-running Chrome |
| Your sessions | ❌ Fresh browser, no logins | ✅ Your tabs, cookies, logged-in sessions |
| Use case | Automated testing, clean-room scraping | Debugging, inspecting, interacting with your real browser |
| Setup complexity | Low (works out of the box) | Medium (requires Chrome flags + separate profile) |
Playwright MCP is the default browser plugin in Claude Code. It works great for automation — but it cannot attach to your running Chrome session. If Chrome is already open, Playwright will fail with a launchPersistentContext error because two Chrome instances can't share the same user data directory.
If you want Claude Code to see your browser, you need the Chrome DevTools MCP — and that means setting up Claude Code Chrome remote debugging properly.
Claude Code Chrome Remote Debugging Setup (Mac)
Here's the exact setup, including the pitfalls I hit along the way.
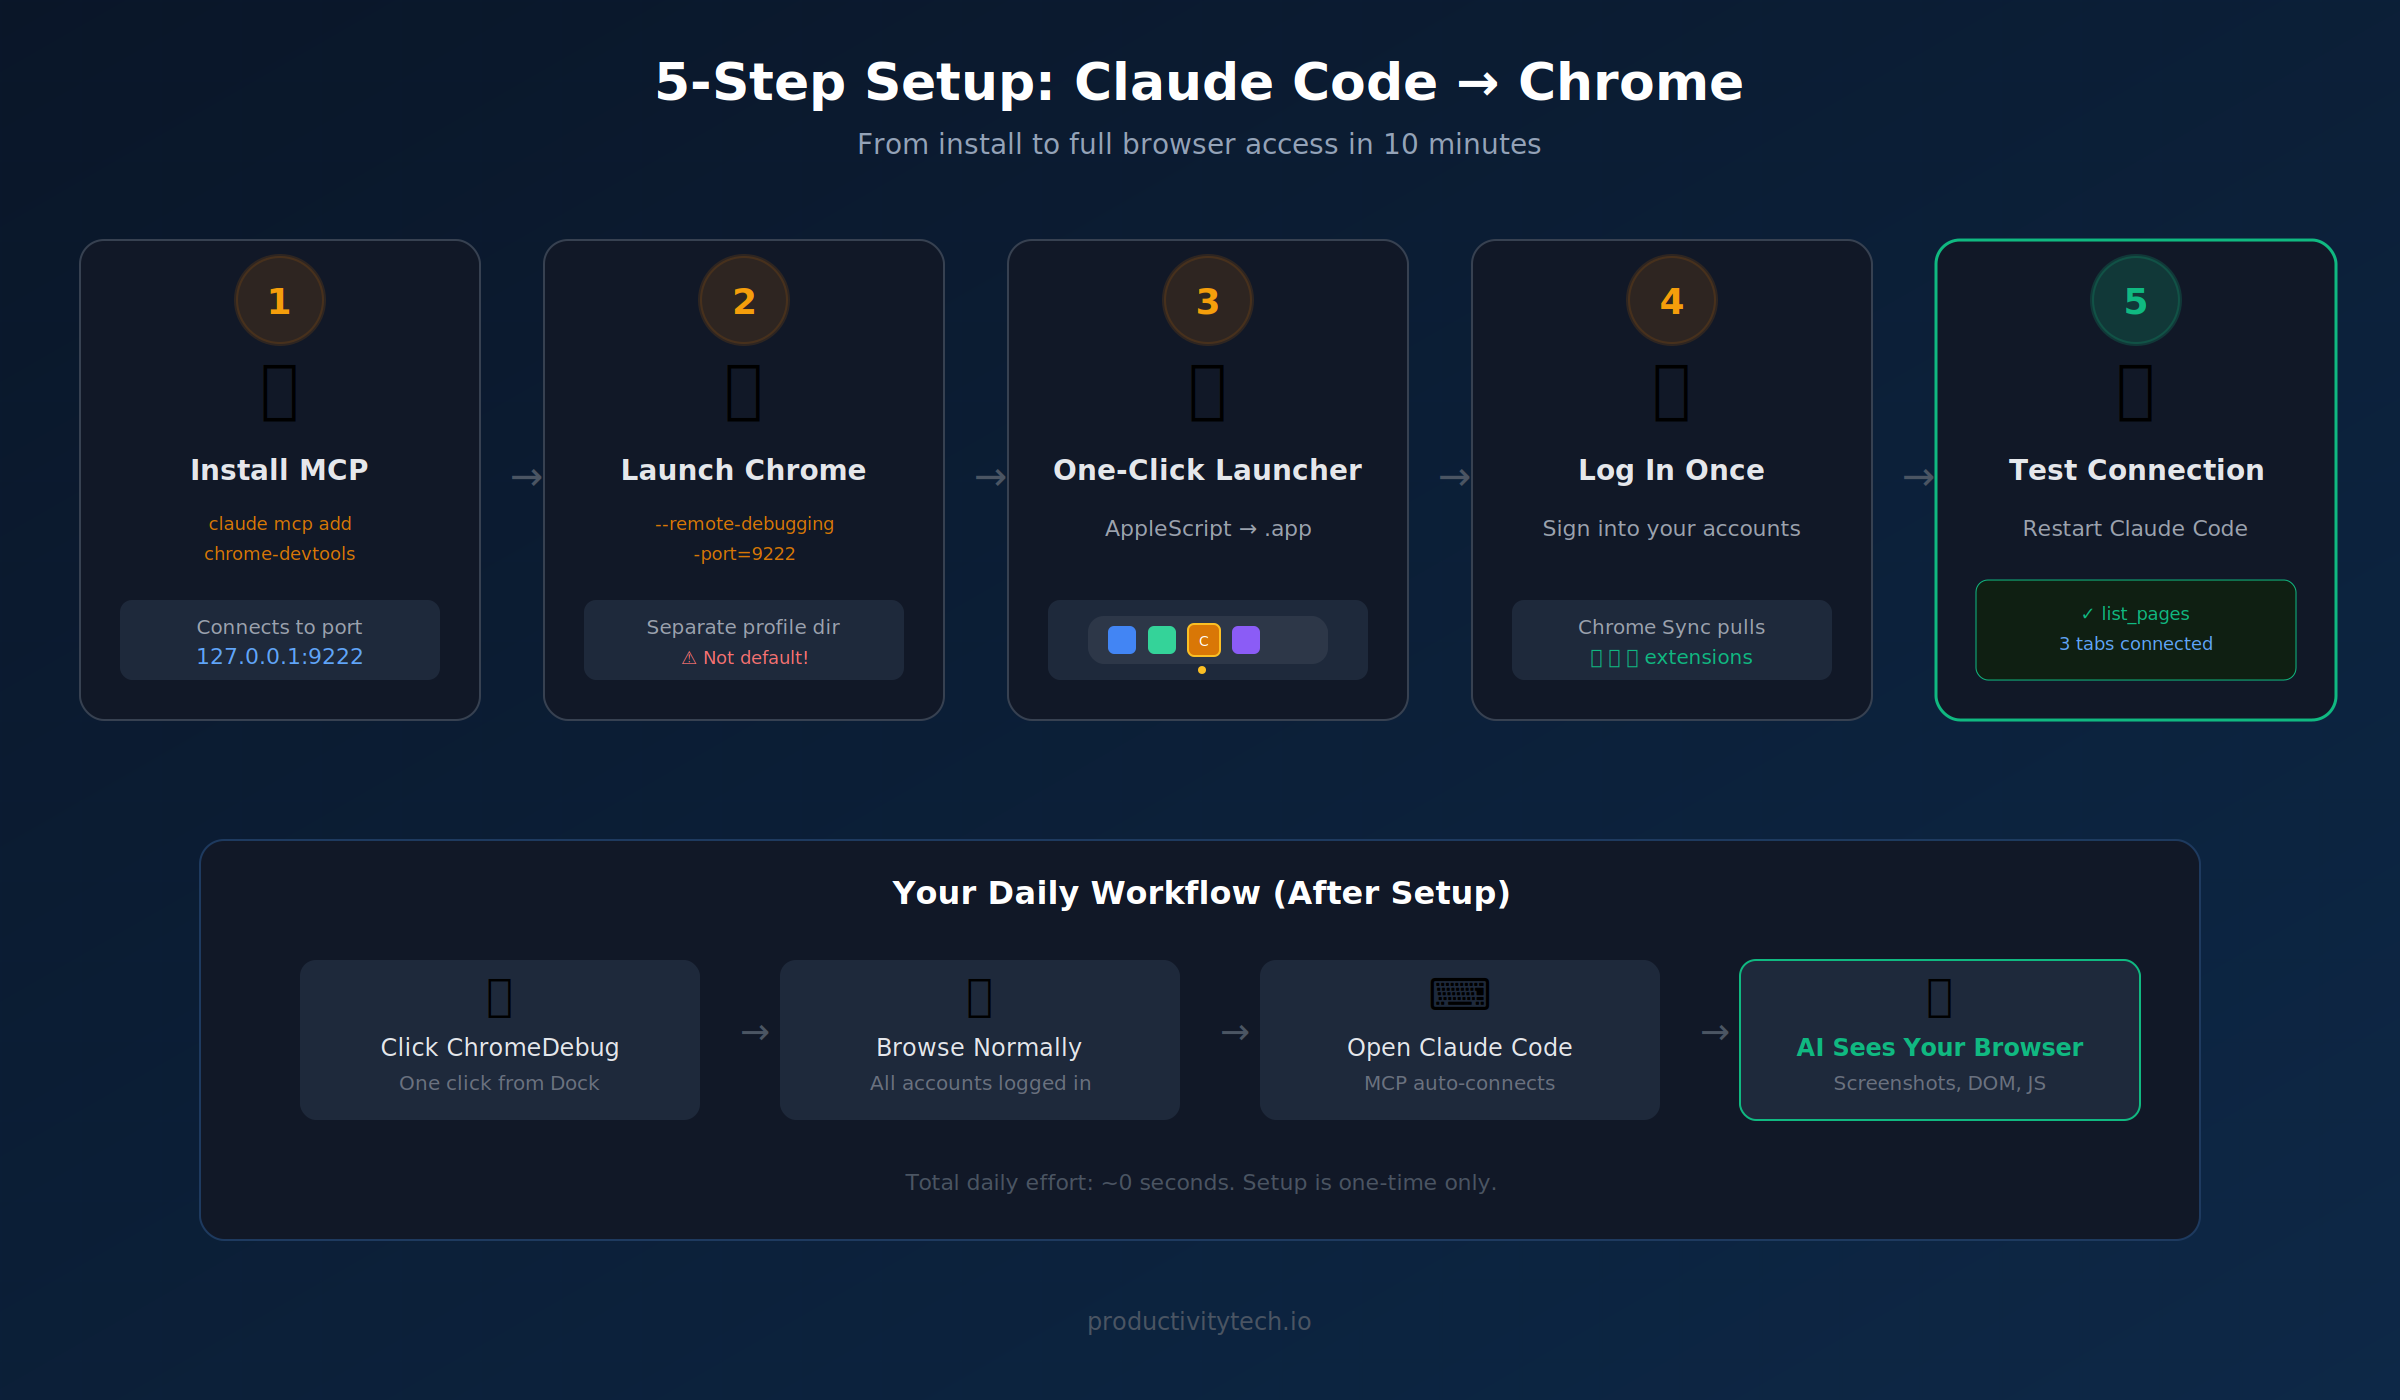
Step 1: Install the Chrome DevTools MCP in Claude Code
Run this in your terminal:
claude mcp add chrome-devtools --scope user -- npx chrome-devtools-mcp@latest --browser-url=http://127.0.0.1:9222 --no-usage-statisticsThis tells Claude Code to connect to Chrome on port 9222 using the chrome-devtools-mcp package.
Step 2: Launch Chrome With Remote Debugging Enabled
This is where most people get stuck. There are three gotchas you need to know:
Gotcha 1: The Chrome UI toggle doesn't work for CDP.
Chrome has a "remote debugging" option in its developer settings. Enabling it does open port 9222 — but the CDP HTTP endpoints (/json/version, /json/list) return 404 or empty responses. The MCP can't connect. You must use the command-line flag instead.
Gotcha 2: You can't use your default profile.
If you try:
"/Applications/Google Chrome.app/Contents/MacOS/Google Chrome"
  --remote-debugging-port=9222
  --user-data-dir="$HOME/Library/Application Support/Google/Chrome"
Chrome will reject it with:
DevTools remote debugging requires a non-default data directory.
Chrome intentionally blocks remote debugging on your default profile for security reasons.
Gotcha 3: You need a separate debug profile.
The solution is a dedicated profile directory:
"/Applications/Google Chrome.app/Contents/MacOS/Google Chrome"
  --remote-debugging-port=9222
  --user-data-dir="$HOME/.chrome-debug-profile"
This launches Chrome with CDP fully active. You can verify it works:
curl -s http://127.0.0.1:9222/json/versionYou should see a JSON response with the browser version and WebSocket URL.
Step 3: Create a One-Click Launcher (No Terminal Needed)
Launching from the terminal every time is annoying. Instead, create an AppleScript app you can put in your Dock:
# Create the AppleScript
cat > /tmp/ChromeDebug.applescript << 'EOF'
do shell script ""/Applications/Google Chrome.app/Contents/MacOS/Google Chrome" --remote-debugging-port=9222 --user-data-dir="" & (POSIX path of (path to home folder)) & ".chrome-debug-profile" &> /dev/null &"
EOF

# Compile it into an app
osacompile -o ~/Desktop/ChromeDebug.app /tmp/ChromeDebug.applescript
Now drag ChromeDebug.app from your Desktop to the Dock. One click launches the debug browser.
Note: macOS may show a notification: "applet was prevented from modifying apps on your Mac." This is a Gatekeeper warning about the AppleScript app — Chrome still launches correctly. You can safely ignore it.
Step 4: Log In Once
The debug profile starts fresh — no bookmarks, no extensions, no logins. But this is a one-time setup:
- Open ChromeDebug from the Dock
- Sign into your Google account
- Chrome Sync will pull in your bookmarks, passwords, and extensions
- Log into any sites you frequently use with Claude Code
The profile persists in ~/.chrome-debug-profile, so everything stays between sessions.
Step 5: Restart Claude Code and Test
Restart Claude Code so it picks up the new MCP server. Then test the connection:
❯ Can you see my browser?

⏺ chrome-devtools - list_pages (MCP)
⎿  ## Pages
   1: https://productivitytech.io/ [selected]
   2: https://www.google.com/
   ...
Claude Code can now see your open tabs, take screenshots, run JavaScript, inspect the DOM, and navigate — all in your actual browser session.
Your Daily Workflow
Once your Claude Code Chrome remote debugging setup is complete, the daily workflow is simple:
- Click ChromeDebug in your Dock — launches Chrome with CDP on port 9222
- Browse normally — it's a full Chrome browser with all your accounts
- Open Claude Code — the MCP auto-connects to your debug Chrome
- Ask Claude to interact — "take a screenshot", "check the console for errors", "click the submit button"
You can run regular Chrome alongside the debug Chrome. They use separate profiles and don't interfere with each other.
Troubleshooting
| Problem | Cause | Fix |
|---|---|---|
Could not connect to Chrome | Chrome isn't running with the debug flag | Launch via ChromeDebug.app, not regular Chrome |
Failed to fetch browser webSocket URL | Port 9222 isn't responding to CDP | Verify with curl http://127.0.0.1:9222/json/version |
non-default data directory error | Using --user-data-dir pointing to default profile | Use a custom path like ~/.chrome-debug-profile |
launchPersistentContext error | Playwright MCP, not Chrome DevTools MCP | Install chrome-devtools-mcp per Step 1 |
| Port 9222 open but empty responses | Enabled via Chrome UI, not CLI flag | Quit Chrome, relaunch with --remote-debugging-port=9222 |
What Claude Code Can Do With Chrome Remote Debugging
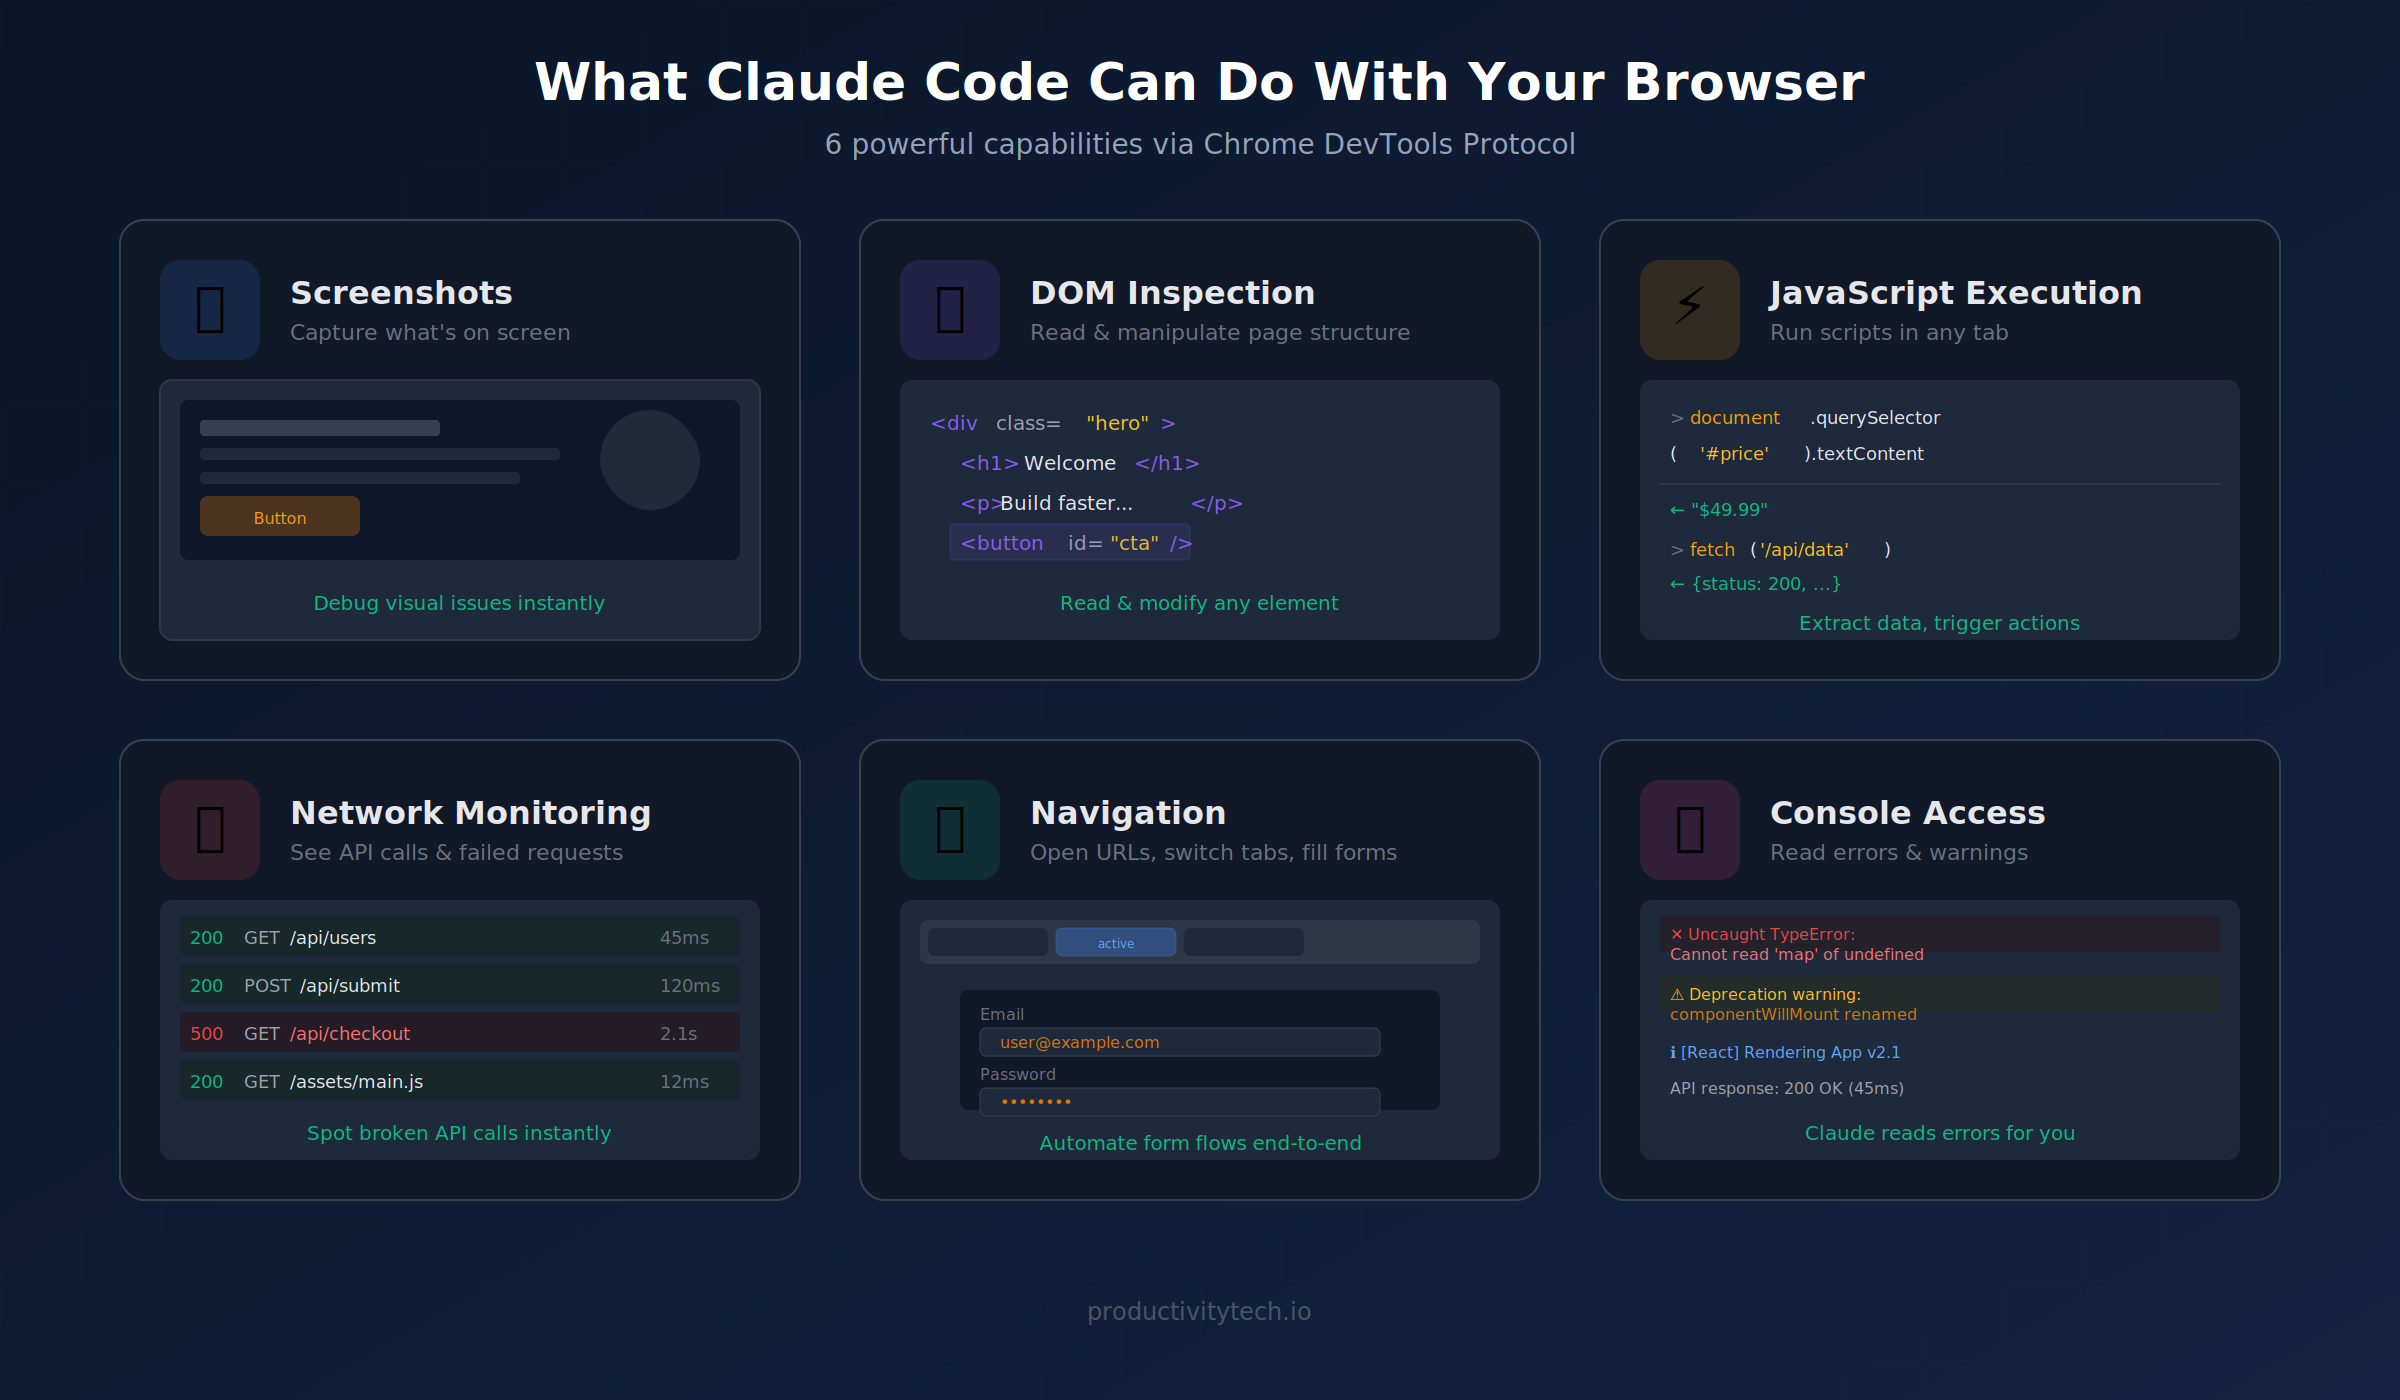
With the Chrome DevTools MCP connected, Claude Code gains powerful capabilities:
- Screenshots — capture what's on screen, useful for debugging visual issues
- DOM inspection — read and manipulate the page structure
- JavaScript execution — run scripts in the context of any open tab
- Network monitoring — see API calls, check for failed requests
- Navigation — open URLs, switch between tabs, fill forms
- Console access — read errors and warnings from the browser console
Claude Code Chrome remote debugging turns your AI coding assistant from a code-only tool into a full-stack debugging assistant that can see what you see.
Frequently Asked Questions (FAQ)
Does the debug Chrome share data with my regular Chrome?
No. The debug profile (~/.chrome-debug-profile) is completely separate from your default Chrome profile. Bookmarks, history, and cookies are independent. If you sign into Google in the debug Chrome, Chrome Sync will bring over bookmarks and passwords — but the two browsers remain isolated.
Is it safe to run Chrome with remote debugging enabled?
The debug port (9222) only listens on localhost (127.0.0.1), so it’s not accessible from other machines on your network. However, any local process can connect to it. Don’t run untrusted software while the debug Chrome is open. For daily development work, the risk is minimal.
Can I use this on Windows or Linux?
Yes, the same approach works. Replace the Chrome binary path and user data directory with the platform-specific equivalents. On Windows: chrome.exe u002du002dremote-debugging-port=9222 u002du002duser-data-dir=C:u005cchrome-debug-profile. On Linux: google-chrome u002du002dremote-debugging-port=9222 u002du002duser-data-dir=~/.chrome-debug-profile. The claude mcp add command is identical on all platforms.
Why not just use Playwright MCP?
Playwright MCP launches a fresh, isolated Chrome instance — great for automated testing, but it can’t access your existing browser sessions. If you need Claude Code to see a page you’re already logged into, interact with your real cookies, or debug something in your actual browsing context, Chrome DevTools MCP is the right choice.
Can I run both Playwright MCP and Chrome DevTools MCP?
Yes. They’re independent MCP servers. Playwright handles automated testing in a clean environment, Chrome DevTools MCP handles interaction with your real browser. You can have both configured in Claude Code and use whichever fits the task.
Want to try it? The entire setup takes about 10 minutes. Install the MCP, create the launcher app, sign in once — and you'll have an AI coding assistant that can actually see your browser. It's one of those small workflow upgrades that changes how you work with Claude Code daily.
For more developer productivity tools and workflows, check out ProductivityTech.
Indie maker and developer. Building productivity tools and writing about systems, automation, and the craft of focused work.
Want a custom Notion template?
Browse my ready-made tools or get in touch for a custom build.