Claude Code Chrome Remote Debugging: 5 Easy Steps That Work
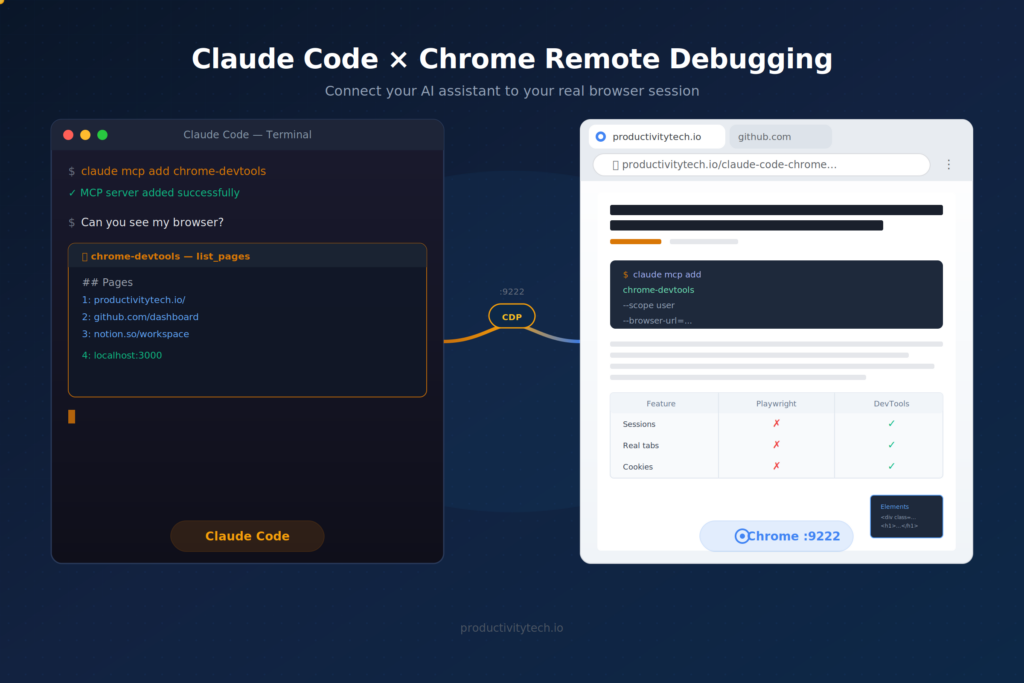
This guide explains how to connect Claude Code to your running Chrome browser using Chrome DevTools MCP and remote debugging. Key steps: install the MCP server, launch Chrome with a custom profile and `--remote-debugging-port=9222` flag, and create a one-click launcher. This enables Claude to take screenshots, inspect DOM, and run JavaScript in your actual browser sessions.
Quick Take: There are now three ways to connect Claude Code to your Chrome browser — and which one is right for you depends on your Chrome version, your Anthropic plan, and what you’re trying to debug. This guide covers all three: Chrome’s new --autoConnect flag (Chrome 144+, fastest setup), Anthropic’s official Claude in Chrome extension (claude --chrome, requires a paid plan), and the manual --remote-debugging-port=9222 approach (works everywhere, most control). I’ll show you when to use each one — and the gotchas the official docs gloss over.
If you’ve tried to get Claude Code to interact with your Chrome browser — taking screenshots, inspecting pages, running JavaScript on your open tabs — you’ve probably hit a wall of confusing errors. The setup landscape changed significantly in late 2025: Anthropic shipped the Claude in Chrome extension, and the Chrome team added a one-click --autoConnect flow in Chrome 144. But the old manual path still has its place. Here’s everything that actually works in 2026.
Which method should you use?
Three paths, three tradeoffs. Pick the one that matches your situation:
| Method | Best for | Chrome version | Plan required | Setup time |
|---|---|---|---|---|
1. --autoConnect (Chrome team) | Most users on macOS / Linux who already use Chrome | 144+ | Any (Free works) | ~2 min |
| 2. Claude in Chrome extension (Anthropic) | Pro/Max/Team/Enterprise users on a direct Anthropic plan | Any (Chrome or Edge) | Pro+ (direct, not Bedrock/Vertex) | ~1 min |
3. Manual --remote-debugging-port=9222 | WSL, Chrome <144, custom automation, full control | Any | Any | ~10 min |
If you’re on Chrome 144 or newer, start with Method 1. If you have a paid Anthropic plan and want the smoothest UX, Method 2. If neither fits — or you need fine-grained control over the browser process — the manual setup in Method 3 still works perfectly.
Why connect Claude Code to your browser at all?
Claude Code is powerful for writing and editing code. But sometimes you need it to see what’s happening in the browser — your actual browser, with your logged-in sessions, your open tabs, your cookies.
- Debugging a live site — Claude inspects the DOM, reads console errors, sees what you see
- Verifying changes in real time — make a code change, then have Claude open the page and confirm the result visually
- Working with authenticated apps — Google Docs, Notion, Gmail, internal dashboards — without sharing credentials or building API integrations
- Automating repetitive browser tasks — fill forms, click through flows, extract data from pages you’re already logged into
Method 1: --autoConnect (Chrome 144+, fastest)
In December 2025, the Chrome team shipped a new --autoConnect mode for the Chrome DevTools MCP server. Instead of launching Chrome with a special flag and a separate profile, you now enable remote debugging once in chrome://inspect, configure the MCP server with --autoConnect, and approve a permission dialog the first time you connect. That’s it — your everyday Chrome profile, no separate launcher, no terminal gymnastics.
Step 1: Enable remote debugging in Chrome
You need Chrome 144 or newer. As of early 2026, that means Chrome Beta — Chrome 144 stable is rolling out. Check your version at chrome://settings/help; switch to the Beta channel (google.com/chrome/beta) if you’re behind.
- Open
chrome://inspect/#remote-debugging - Click Enable remote debugging
- Follow the dialog UI to allow incoming debugging connections
This is a one-time toggle. Until you flip it off, Chrome will respond to --autoConnect requests from local MCP clients (with a per-session permission dialog).
Step 2: Add the MCP server to Claude Code
claude mcp add chrome-devtools --scope user -- npx chrome-devtools-mcp@latest --autoConnect --channel=beta --no-usage-statisticsThe --channel=beta argument tells the MCP server which Chrome user data directory to use. Drop it (or set --channel=stable) once Chrome 144 lands on the stable channel. Use --channel=canary if you’re on Canary.
Step 3: Approve and test
Restart Claude Code so it picks up the new MCP server, then ask it to interact with the browser:
❯ Take a snapshot of the page I have open
⏺ chrome-devtools - take_snapshot (MCP)
Chrome will pop up a permission dialog: “chrome-devtools-mcp wants to start a remote debugging session.” Click Allow. While the session is active, you’ll see a banner at the top of Chrome reading “Chrome is being controlled by automated test software.” That’s expected — it’s there so you always know when an agent is driving your browser.
autoConnect gotchas
- The permission dialog appears every session. That’s by design — Chrome shows it each time the MCP requests a debugging connection so a malicious local process can’t quietly attach. Living with it is the price of using your real profile.
- It connects to your default Chrome profile. If you have multiple profiles, the MCP picks the one Chrome considers default. There’s no way to choose another one — for that, fall back to Method 3.
- Chrome must already be running. autoConnect doesn’t launch Chrome for you. Open Chrome first, then run your Claude command.
- Extensions tools aren’t supported yet on autoConnect. Per the README, extension-related MCP tools require a pipe connection until Chrome 149. Most users don’t notice — you’re not asking Claude to manipulate extensions.
- WSL is not supported. If you’re on Windows running Chrome under WSL, you’ll need Method 3 with explicit port forwarding.
Method 2: Claude in Chrome extension (Anthropic, paid plans)
This is a separate product from chrome-devtools-mcp — and it’s the one most people confuse. Anthropic ships a Chrome extension that creates a native messaging bridge between Claude Code and your browser. No remote debugging port, no MCP server config, no special Chrome flags. Just install the extension, launch Claude with --chrome, and start asking it to use the browser.
Setup
- Install the Claude in Chrome extension from the Chrome Web Store (version 1.0.36 or higher; works in Chrome and Microsoft Edge)
- Make sure Claude Code is version 2.0.73 or newer (
claude --version) - Launch with
claude --chrome— or run/chromeinside an existing session to enable - To enable Chrome by default, run
/chromeand choose Enabled by default
Inside the session, Claude opens new tabs for browser tasks and inherits your login state, so it can access any site you’re already signed into. When it hits a login page or CAPTCHA, it pauses and asks you to handle it manually.
When you should — and shouldn’t — use this method
Use it if you have a direct Anthropic plan (Pro, Max, Team, or Enterprise) and want the smoothest UX. The extension is officially supported, has a polished permission model per site, and gets fixes faster than community MCP servers.
Skip it if any of these apply:
- You access Claude through Amazon Bedrock, Google Cloud Vertex AI, or Microsoft Foundry — Chrome integration is not available via third-party providers
- You’re on Brave, Arc, or another Chromium-based browser — only Chrome and Edge are supported
- You’re on WSL — not supported
- You need DevTools-style features (network throttling, performance traces) — chrome-devtools-mcp exposes more low-level CDP capabilities
You can run the Claude in Chrome extension and chrome-devtools-mcp side by side. They don’t conflict. Use the extension for everyday browsing tasks (form filling, content drafting, multi-site workflows) and chrome-devtools-mcp when you need to inspect the DOM at scale, capture network requests, or run performance audits.
Method 3: Manual --remote-debugging-port=9222 (the original setup)
This is the original way to connect Claude Code to a real Chrome session, and it still has the most control. Use it if Methods 1 and 2 don’t fit — for example, on Chrome <144, on WSL, when you need to script a specific automation environment, or when you want to keep your debug Chrome on a separate profile from your daily Chrome.
It’s also the one with the most gotchas. Below is the exact setup that works on macOS, plus notes for Linux and Windows.
Step 1: Install Chrome DevTools MCP in Claude Code
claude mcp add chrome-devtools --scope user -- npx chrome-devtools-mcp@latest --browser-url=http://127.0.0.1:9222 --no-usage-statisticsThis tells Claude Code to connect to whatever Chrome instance is exposing port 9222.
Step 2: Launch Chrome with remote debugging enabled
This is where most people get stuck. Three gotchas:
Gotcha 1: The Chrome UI toggle alone doesn’t work for CDP.
Chrome’s chrome://inspect “remote debugging” toggle opens port 9222, but the CDP HTTP endpoints (/json/version, /json/list) return 404 or empty responses on older builds. The MCP can’t connect. You must use the command-line flag instead — or use Method 1’s --autoConnect on Chrome 144+, which talks to the toggle natively.
Gotcha 2: You can’t use your default profile.
If you try to point --user-data-dir at your default Chrome profile, Chrome rejects it:
DevTools remote debugging requires a non-default data directory.This is intentional. Chrome blocks remote debugging on your default profile so a local malicious process can’t read your full browsing state. The fix is a dedicated profile directory.
Gotcha 3: You need a separate debug profile.
"/Applications/Google Chrome.app/Contents/MacOS/Google Chrome" \
  --remote-debugging-port=9222 \
  --user-data-dir="$HOME/.chrome-debug-profile"
This launches Chrome with CDP fully active. Verify it works:
curl -s http://127.0.0.1:9222/json/versionYou should see a JSON response with the browser version and a WebSocket URL.
Step 3: Create a one-click launcher (optional, macOS)
Launching from the terminal every time gets old. Wrap the command in an AppleScript app you can keep in the Dock:
# Create the AppleScript
cat > /tmp/ChromeDebug.applescript << 'EOF'
do shell script "\"/Applications/Google Chrome.app/Contents/MacOS/Google Chrome\" --remote-debugging-port=9222 --user-data-dir=" & (POSIX path of (path to home folder)) & ".chrome-debug-profile &> /dev/null &"
EOF

# Compile it into an app
osacompile -o ~/Desktop/ChromeDebug.app /tmp/ChromeDebug.applescript
Drag ChromeDebug.app from your Desktop into the Dock. One click launches the debug browser. macOS may flash a Gatekeeper notice — Chrome still launches correctly, you can dismiss it.
Step 4: Sign in once
The debug profile starts empty. Sign into Google once and let Chrome Sync pull in bookmarks, passwords, and extensions. Log into any sites you frequently use with Claude Code. Everything persists in ~/.chrome-debug-profile, so you only do this once.
Step 5: Restart Claude Code and test
❯ Can you see my browser?
⏺ chrome-devtools - list_pages (MCP)
⎿ ## Pages
  1: https://productivitytech.io/ [selected]
  2: https://www.google.com/
  ...
Claude Code can now see your open tabs, take screenshots, run JavaScript, inspect the DOM, and navigate — all in your debug Chrome session.
Linux and Windows variants
- Linux:
google-chrome --remote-debugging-port=9222 --user-data-dir=~/.chrome-debug-profile. On Wayland sessions you may also need--ozone-platform=waylandif Chrome refuses to launch — see Alexander Zeitler’s writeup for the full fix. - Windows:
"C:\Program Files\Google\Chrome\Application\chrome.exe" --remote-debugging-port=9222 --user-data-dir="%TEMP%\chrome-debug-profile". - WSL: if Chrome runs on Windows but Claude Code runs in WSL, port 9222 isn’t reachable across the boundary by default. Either run Claude Code on Windows directly, or set up port forwarding (
netsh interface portproxy) — full instructions in the chrome-devtools-mcp troubleshooting docs.
Daily workflow once it’s set up
- Method 1 (autoConnect): open Chrome, run Claude Code, approve the dialog when it appears. The MCP picks up your existing tabs.
- Method 2 (extension): launch with
claude --chrome(or have it on by default). Claude opens new tabs as needed and inherits your logins. - Method 3 (manual): click your
ChromeDebuglauncher (or run the command), then start Claude Code. The MCP auto-connects to port 9222.
You can run regular Chrome alongside any of these — separate profiles don’t interfere with each other.
Troubleshooting
| Problem | Likely cause | Fix |
|---|---|---|
| autoConnect: nothing happens, no dialog | Remote debugging not enabled in chrome://inspect/#remote-debugging | Toggle it on once; restart Chrome and Claude Code |
autoConnect: --channel=beta wrong directory | You’re on stable Chrome but passed --channel=beta | Drop the flag (defaults to stable) or pass the channel you actually run |
| Could not connect to Chrome | Method 3: Chrome isn’t running with the debug flag | Launch via ChromeDebug.app, not regular Chrome |
| Failed to fetch browser webSocket URL | Port 9222 isn’t responding to CDP | Verify with curl http://127.0.0.1:9222/json/version |
| non-default data directory error | Method 3: --user-data-dir points to your default profile | Use a custom path like ~/.chrome-debug-profile |
| launchPersistentContext error | You’re hitting Playwright MCP, not chrome-devtools-mcp | Confirm the MCP install command from Method 1 or 3 |
| “Browser extension is not connected” (Method 2) | Native messaging host can’t reach the extension | Restart Chrome and Claude Code; run /chrome and pick Reconnect extension |
| “Extension not detected” (Method 2) | The Chrome extension isn’t installed or is disabled | Install or enable it at chrome://extensions; restart Chrome |
What Claude Code can do once it’s connected
- Screenshots — capture full pages or specific elements, useful for visual debugging
- DOM inspection — read and manipulate the page structure
- JavaScript execution — run scripts in the context of any open tab
- Network monitoring — see API calls, find failed requests, inspect headers
- Navigation — open URLs, switch between tabs, fill forms, click through flows
- Console access — read errors and warnings from the browser console
- Performance traces (Method 1 and 3) — Lighthouse-style audits and trace analysis
The combination turns Claude Code from a code-only tool into a full-stack debugging assistant that can actually see what you see — and act on it.
FAQ
Should I use autoConnect or the manual --remote-debugging-port?
Use autoConnect if you’re on Chrome 144+, want to use your real profile, and don’t mind clicking Allow once per session. Use the manual port flag if you need a separate clean profile, you’re on older Chrome, or you want to script the launch from CI / a one-click app.
Why doesn’t autoConnect work on my Chrome?
Three usual causes: (1) you’re on Chrome <144 — check chrome://settings/help and switch to Beta if needed; (2) you didn’t enable remote debugging at chrome://inspect/#remote-debugging first; (3) you passed the wrong --channel for your install (e.g., you’re on stable but the MCP is configured for beta). Drop the flag entirely or match it to your actual channel.
Can I use the Claude in Chrome extension and chrome-devtools-mcp at the same time?
Yes — they’re independent. The extension uses Anthropic’s native messaging bridge; chrome-devtools-mcp uses the Chrome DevTools Protocol. They don’t fight each other. A common pattern: the extension for everyday browsing tasks (form filling, multi-site workflows), chrome-devtools-mcp when you need DOM-level inspection, network captures, or performance traces.
Does the debug Chrome share data with my regular Chrome?
Method 1 (autoConnect) uses your default Chrome profile, so yes — same bookmarks, history, cookies. Method 3 (manual) uses ~/.chrome-debug-profile, which is fully isolated. If you sign into Google in either, Chrome Sync brings over bookmarks and passwords, but the profiles are still independent on disk.
Is it safe to run Chrome with remote debugging enabled?
Port 9222 only listens on localhost (127.0.0.1), so it’s not reachable from other machines on your network. Any local process can connect, though, so don’t run untrusted software while a debug Chrome is open. Method 1’s permission dialog adds an extra safety layer — even local processes have to be approved by you. For typical development work, the risk is minimal.
What about WSL?
The Claude in Chrome extension explicitly does not support WSL. autoConnect doesn’t bridge the WSL/Windows boundary either. Method 3 works with manual port forwarding (netsh interface portproxy) — see the chrome-devtools-mcp troubleshooting docs for the exact incantation. The simpler fix is to run Claude Code natively on Windows alongside Chrome.
Why not just use Playwright MCP?
Playwright MCP launches a fresh, isolated Chrome instance — great for automated testing, but it cannot access your existing browser sessions. If you need Claude Code to see a page you’re already logged into, interact with your real cookies, or debug something in your actual browsing context, you want one of the three methods above. You can run Playwright MCP and chrome-devtools-mcp side by side; they don’t conflict.
Does agent-browser simplify this setup?
No. Despite marketing “auto-connect” and “auto-discovery”, agent-browser still requires the same --remote-debugging-port=9222 flag on Chrome. It’s a Rust CLI tool, not an MCP server, so it doesn’t integrate with Claude Code natively. If you want auto-connect, use Method 1’s --autoConnect instead — same outcome, no extra binary.
Want to try it? Pick the method that matches your setup, follow the steps, and you’ll have an AI coding assistant that can actually see your browser. It’s one of the small workflow upgrades that quietly changes how you use Claude Code every day.
For more developer productivity tools and workflows, browse ProductivityTech or check out the related guide on Claude Code automation in 2026.
Indie maker and developer. Building productivity tools and writing about systems, automation, and the craft of focused work.
Want a custom Notion template?
Browse my ready-made tools or get in touch for a custom build.